


Our weekly newsletter presents key trends derived from observable Syndicated Bank Loan pricing data over a weekly period.
- Top 10 Loan Price Winners
- Top 10 Loan Price Losers
- Average Bid Price (By industry sector)
- Market Sentiment
- Top Quote Volume Movers
- Most Quoted Loans
- Bid and Offer Volume
- Bid Offer Spread (By industry sector)
| TOP 10 WINNERS | ||||
| Rank | Loan | Chg | Price | Price - 1W |
| 1 | PROGREXION TL | 11.02% | 53.28 | 47.99 |
| 2 | GIVE & GO TL B | 1.55% | 99.77 | 98.25 |
| 3 | CROSSMARK TL | 1.18% | 95.40 | 94.30 |
| 4 | ALVOGEN TL B | 1.07% | 94.29 | 93.30 |
| 5 | EQUITRANS MIDSTREAM TL B | 1.04% | 99.15 | 98.13 |
| 6 | HEALOGICS EXT TL B | 0.83% | 77.33 | 76.69 |
| 7 | ARRAY CANADA TL B | 0.58% | 72.49 | 72.08 |
| 8 | AKORN TL B | 0.51% | 96.75 | 96.26 |
| 9 | DUPAGE MEDICAL GROUP 2ND LIEN TL | 0.49% | 97.43 | 96.95 |
| 10 | CATALINA MARKETING EXIT TL | 0.46% | 75.34 | 75.00 |
- Showcases the top 10 loan "winners" based on the largest bid price increases between 2/28/20 - 3/6/20
| TOP 10 LOSERS | ||||
| Rank | Loan | Chg | Price | Price - 1W |
| 1 | WINDSTREAM SERVICES LLC TL B6 | -21.06% | 74.38 | 94.23 |
| 2 | TRAVELPORT 2ND LIEN TL | -15.82% | 68.61 | 81.50 |
| 3 | PEABODY ENERGY TL B | -14.71% | 67.55 | 79.20 |
| 4 | PHILADELPHIA ENERGY TL B | -13.50% | 32.19 | 37.22 |
| 5 | VIVID SEATS TL | -11.47% | 85.01 | 96.03 |
| 6 | AMC ENTERTAINMENT TL B1 | -10.56% | 88.17 | 98.58 |
| 7 | LSC COMMUNICATIONS TL B | -10.52% | 59.69 | 66.71 |
| 8 | AUDIO VISUAL TL B | -9.63% | 89.84 | 99.41 |
| 9 | KCA DEUTAG TL B | -9.25% | 62.36 | 68.71 |
| 10 | CALIFORNIA RESOURCES TL | -8.98% | 52.47 | 57.65 |
- Showcases the top 10 loan "losers" based on the largest bid price decreases between 2/28/20 - 3/6/20
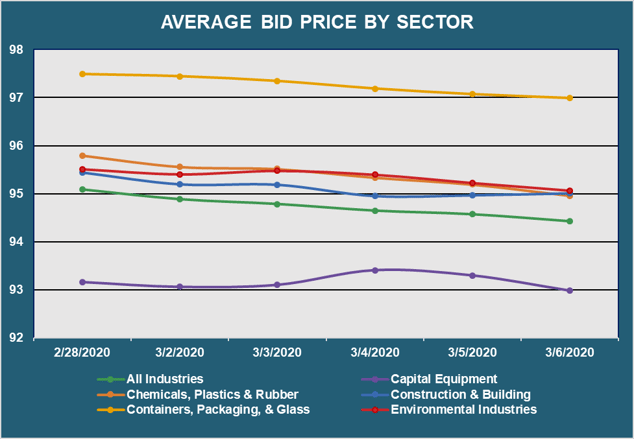
- Displays the average loan bid price by sector between 2/28/20 - 3/6/20
- Results are based on 5 select industry sectors, however, we offer data across 36 sectors
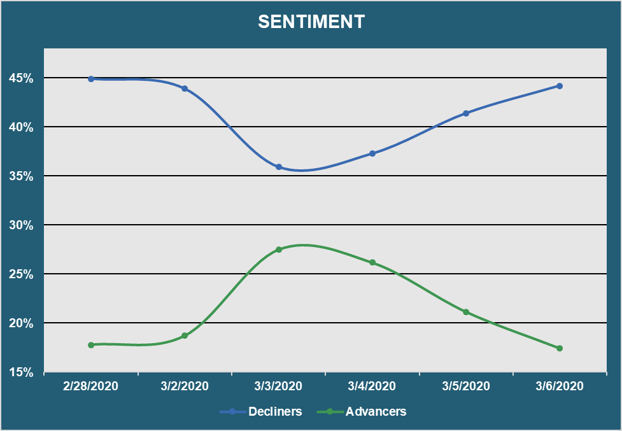
- Reveals the percent of loans increasing in price (advancers) vs. loans decreasing in price (decliners) between 2/28/20 - 3/6/20
| TOP QUOTE VOLUME MOVERS: THIS WEEK vs LAST WEEK | |||||
| RANK | TRANCHE |
PRIOR WEEK |
THIS WEEK |
INCREASE | % INCREASE |
| 1 | NTL CABLE PLC EUR TL O | 16 | 30 | 14 | 88% |
| 2 | GTT COMMUNICATIONS EUR TL B | 8 | 21 | 13 | 163% |
| 3 | IFCO EUR TL B | 10 | 22 | 12 | 120% |
| 4 | FRONERI TL B | 4 | 16 | 12 | 300% |
| 5 | NTL CABLE PLC GBP TL L | 16 | 28 | 12 | 75% |
| 6 | JBS USA TL B | 33 | 45 | 12 | 36% |
| 7 | BOLUDA TOWAGE EUR TL B1 | 20 | 32 | 12 | 60% |
| 8 | MACDERMID TL B | 17 | 28 | 11 | 65% |
| 9 | NTL CABLE PLC GBP TL M | 17 | 28 | 11 | 65% |
| 10 | MKS INSTRUMENTS TL B6 | 18 | 28 | 10 | 56% |
- Exhibits the loans with the largest increase in quote volume for the week ending 2/28/20 vs. the week ending 3/6/20
| MOST QUOTED LOANS | ||
| RANK | TRANCHE | DEALERS |
| 1 | VERISURE MIDHOLDING AB EUR TL B1 | 17 |
| 2 | SIGMA BIDCO EUR TL B | 16 |
| 3 | HARLAND CLARKE TL B7 | 16 |
| 4 | SEADRILL PARTNERS LLC EXT TL B | 15 |
| 5 | ELSAN GROUPE EUR TL B | 15 |
| 6 | WEBHELP EUR TL B | 15 |
| 7 | HOMEVI EUR TL B | 15 |
| 8 | SERTA SIMMONS TL | 14 |
| 9 | DORNA SPORTS EUR TL B | 14 |
| 10 | ETHYPHARM EUR TL B | 14 |
- Ranks the loans that were quoted by the highest number of dealers between 2/28/20 - 3/6/20
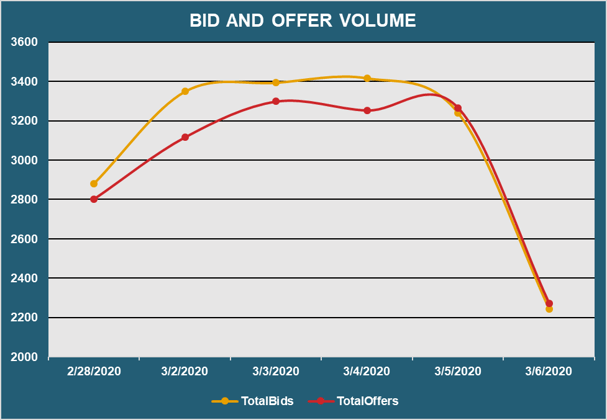
- Reveals the total number of quotes by bid and offer between 2/28/20 - 3/6/20
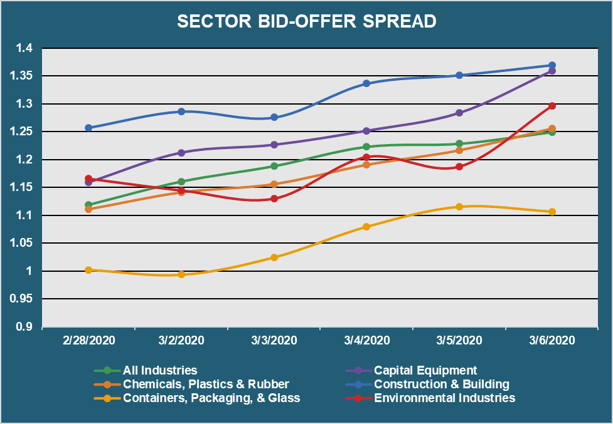
- Displays the bid-offer spread by sector between 2/28/20 - 3/6/20
- Results are based on 5 select industry sectors, however, we offer data across 36 sectors
Want free access to Real-Time Composite pricing and trends within the market for Syndicated Bank Loans?
If you would like to see additional information, or if you have any feedback or questions, please feel free to reach out to us at info@solveadvisors.com or +1 646-699-5041.