We are excited to launch a weekly newsletter to highlight trends in the Municipal Bond market. Our newsletter presents key trends derived from observable Municipal Bond pricing data over a weekly period.
- Top 10 Muni Bond Winners & Losers
- Top 10 Muni State Winners & Losers
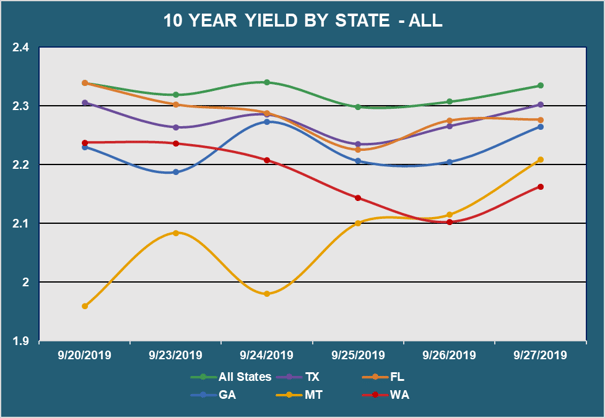
- 10 Yr Yield by State - All Muni
- 10 Yr Yield by State - GO Only
- 10 Yr Yield by State - REV Only
- Market Sentiment
- Top Quote Volume Movers
- Most Quoted Municipal Bonds
| TOP 10 BOND WINNERS |
| Rank |
Bond Name |
Coupon |
Maturity |
Chg |
Price |
Price - 1W |
| 1 |
PR PUB IMPT-SER A |
5.25% |
07/01/24 |
4.90% |
76.50 |
72.92 |
| 2 |
DENAIR USD-CABS |
0.00% |
08/01/43 |
3.70% |
48.97 |
47.22 |
| 3 |
OHIO ST UNIV-TXBL-A |
3.80% |
12/01/46 |
2.72% |
116.02 |
112.95 |
| 4 |
PHILA SD-A-QSCB |
6.00% |
09/01/30 |
2.66% |
126.55 |
123.27 |
| 5 |
CA MUNI FIN AUTH-A |
5.00% |
06/01/35 |
2.62% |
122.78 |
119.65 |
| 6 |
BAY AREA TOLL AUTH-F1 |
5.00% |
04/01/54 |
2.55% |
116.85 |
113.95 |
| 7 |
MUNI ELEC AUTH OF GA |
4.00% |
01/01/49 |
2.51% |
107.04 |
104.42 |
| 8 |
CA MUNI FIN AUTH-A |
5.00% |
06/01/33 |
2.51% |
123.29 |
120.27 |
| 9 |
MUNI ELEC AUTH OF GEO |
4.00% |
01/01/49 |
2.49% |
105.62 |
103.05 |
| 10 |
JEFFERSON UN HSD |
4.65% |
08/01/49 |
2.49% |
109.04 |
106.39 |
| TOP 10 BOND LOSERS |
| Rank |
Bond Name |
Coupon |
Maturity |
Chg |
Price |
Price - 1W |
| 1 |
PR ELEC-WW |
5.50% |
07/01/18 |
-5.57% |
74.60 |
79.00 |
| 2 |
NC EASTN TXB-REF-B |
6.55% |
01/01/24 |
-3.69% |
109.51 |
113.71 |
| 3 |
PUB FIN-MFH-A |
5.25% |
06/01/47 |
-3.47% |
93.11 |
96.46 |
| 4 |
GOLDEN VY USD-B |
0.00% |
08/01/33 |
-3.27% |
68.07 |
70.37 |
| 5 |
CHICAGO BRD OF ED |
6.52% |
12/01/40 |
-2.89% |
111.43 |
114.75 |
| 6 |
CA UNIV REVENUE-A-REF |
5.00% |
11/01/35 |
-2.87% |
123.78 |
127.44 |
| 7 |
PURDUE UNIV |
5.25% |
07/01/29 |
-2.80% |
130.03 |
133.78 |
| 8 |
CO ST HLTH FACS AUTH |
5.00% |
08/01/36 |
-2.61% |
121.78 |
125.05 |
| 9 |
NEW YORK ST URBAN DEV |
3.32% |
03/15/29 |
-2.51% |
106.16 |
108.90 |
| 10 |
NEW YORK CITY TRANS |
2.80% |
02/01/26 |
-2.48% |
103.17 |
105.79 |
- Showcases the top 10 Muni Bond "Winners" and "Losers" based on price movements between 9/20/19 - 9/27/19
| TOP 10 STATE WINNERS |
| Rank |
State Name |
Chg |
Yld |
Yld - 1W |
| 1 |
GA |
-26 bps |
1.97% |
2.23% |
| 2 |
AK |
-23 bps |
2.44% |
2.66% |
| 3 |
AL |
-20 bps |
2.04% |
2.24% |
| 4 |
MN |
-15 bps |
1.83% |
1.98% |
| 5 |
IA |
-13 bps |
1.99% |
2.12% |
| 6 |
MD |
-11 bps |
2.07% |
2.19% |
| 7 |
KS |
-10 bps |
2.40% |
2.50% |
| 8 |
WA |
-7 bps |
1.95% |
2.01% |
| 9 |
HI |
-6 bps |
2.03% |
2.09% |
| 10 |
MS |
-6 bps |
2.02% |
2.08% |
| TOP 10 STATE LOSERS |
| Rank |
State Name |
Chg |
Yld |
Yld - 1W |
| 1 |
RI |
25 bps |
2.10% |
1.85% |
| 2 |
CO |
21 bps |
2.22% |
2.01% |
| 3 |
AR |
17 bps |
2.47% |
2.31% |
| 4 |
MA |
11 bps |
2.09% |
1.98% |
| 5 |
WI |
10 bps |
2.11% |
2.02% |
| 6 |
NY |
9 bps |
2.24% |
2.15% |
| 7 |
CT |
6 bps |
2.29% |
2.24% |
| 8 |
UT |
4 bps |
2.30% |
2.26% |
| 9 |
NJ |
2 bps |
2.19% |
2.17% |
| 10 |
AZ |
1 bps |
3.25% |
3.24% |
- Showcases the top 10 Muni State "Winners" and "Losers" based on yield movements between 9/20/19 - 9/27/19
- Displays the average Muni 10 year yield by state between 9/20/19 - 9/27/19 (General Obligation and Revenue Bonds)
- Results are based on 5 select states, however, we offer data across all 50 states and U.S. territories
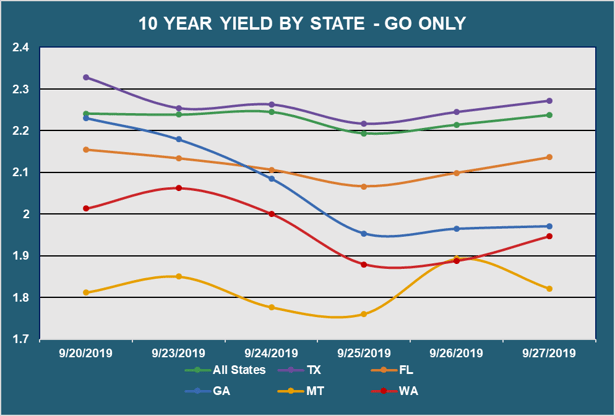
- Displays the average Muni 10 year yield by state between 9/20/19 - 9/27/19 (General Obligation Bonds only)
- Results are based on 5 select states, however, we offer data across all 50 states and U.S. territories
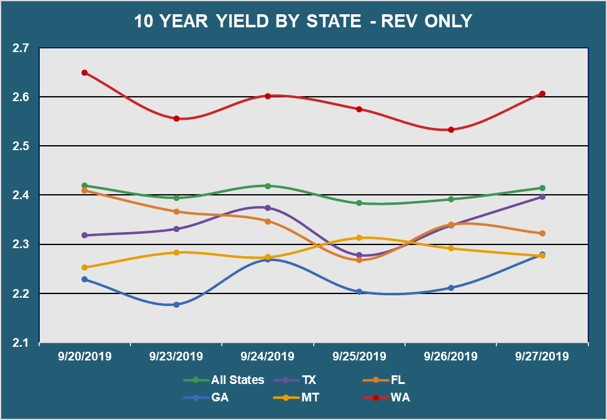
- Displays the average Muni 10 year yield by state between 9/20/19 - 9/27/19 (Revenue Bonds only)
- Results are based on 5 select states, however, we offer data across all 50 states and U.S. territories
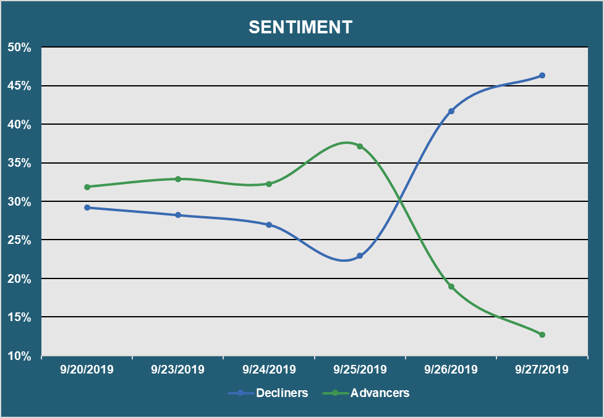
- Reveals the percent of Muni bonds increasing in price (Advancers) vs. decreasing in price (Decliners) between 9/20/19 - 9/27/19
| TOP QUOTE VOLUME MOVERS: THIS WEEK vs LAST WEEK |
| RANK |
TRANCHE |
COUPON |
MATURITY |
PRIOR WEEK
|
THIS WEEK
|
INCREASE |
% INCREASE |
| 1 |
GUILFORD CO-B |
5.00% |
05/01/29 |
9 |
45 |
36 |
400% |
| 2 |
LEANDER ISD-C-CABS |
0.00% |
08/15/49 |
9 |
45 |
36 |
400% |
| 3 |
NEW YORK CITY NY TRAN |
5.00% |
05/01/33 |
3 |
36 |
33 |
1100% |
| 4 |
HAWAII ST |
5.00% |
10/01/31 |
4 |
36 |
32 |
800% |
| 5 |
MI ST FIN AUTH |
5.00% |
11/15/36 |
3 |
34 |
31 |
1033% |
| 6 |
JEFFERSON CO SD R-1 |
4.00% |
12/15/35 |
7 |
36 |
29 |
414% |
| 7 |
MA DEV FIN AGY-REF |
5.00% |
10/01/57 |
22 |
50 |
28 |
127% |
| 8 |
MA ST DEV FIN-F--REF |
5.00% |
08/15/40 |
2 |
30 |
28 |
1400% |
| 9 |
MARYLAND ST-2ND SER A |
5.00% |
08/01/31 |
7 |
32 |
25 |
357% |
| 10 |
PORT AUTH OF NEW YORK |
5.00% |
09/01/37 |
11 |
35 |
24 |
218% |
- Exhibits the Munis with the largest increase in quote volume for the week ending 9/20/19 vs. the week ending 9/27/19
| MOST QUOTED MUNIS |
| RANK |
TRANCHE |
COUPON |
MATURITY |
DEALERS |
| 1 |
MET TRANSPRTN AUTH NY |
5.00% |
11/15/37 |
13 |
| 2 |
NEW YORK ST DORM AUTH |
5.00% |
03/15/36 |
12 |
| 3 |
ATLANTA ARPT REV-D |
4.00% |
07/01/39 |
12 |
| 4 |
CO ST HLTH FACS AUTH |
3.25% |
08/01/49 |
12 |
| 5 |
FAIRFAX INDL DEV-B2 |
5.00% |
05/15/57 |
11 |
| 6 |
PR SALES TAX FING-A1 |
5.00% |
07/01/58 |
11 |
| 7 |
PHILADELPHIA PA HOSPS |
5.00% |
07/01/29 |
11 |
| 8 |
CALIFORNIA |
4.00% |
10/01/39 |
11 |
| 9 |
KILLEEN ISD |
4.00% |
02/15/36 |
11 |
| 10 |
WASHINGTON ST-2020A |
5.00% |
08/01/35 |
11 |
- Ranks the Munis that were quoted by the highest number of dealers between 9/20/19 - 9/27/19
Want free access to Solve's Real-Time Market Data and trends within the market for Municipal Bonds?
If you would like to see additional information, or if you have any feedback or questions, please feel free to reach out to us at info@solveadvisors.com or +1 646-699-5041.